GACE Middle Grades Math Key Concepts to Know
Arithmetic and Algebra
The Arithmetic and Algebra subarea has about 29 questions. These questions account for 65% of the entire exam.
This subarea can be neatly divided into 3 sections:
- Numbers and Operations
- Algebra
- Functions and Their Graphs
So, let’s talk about the Numbers and Operations section first.
Numbers and Operations
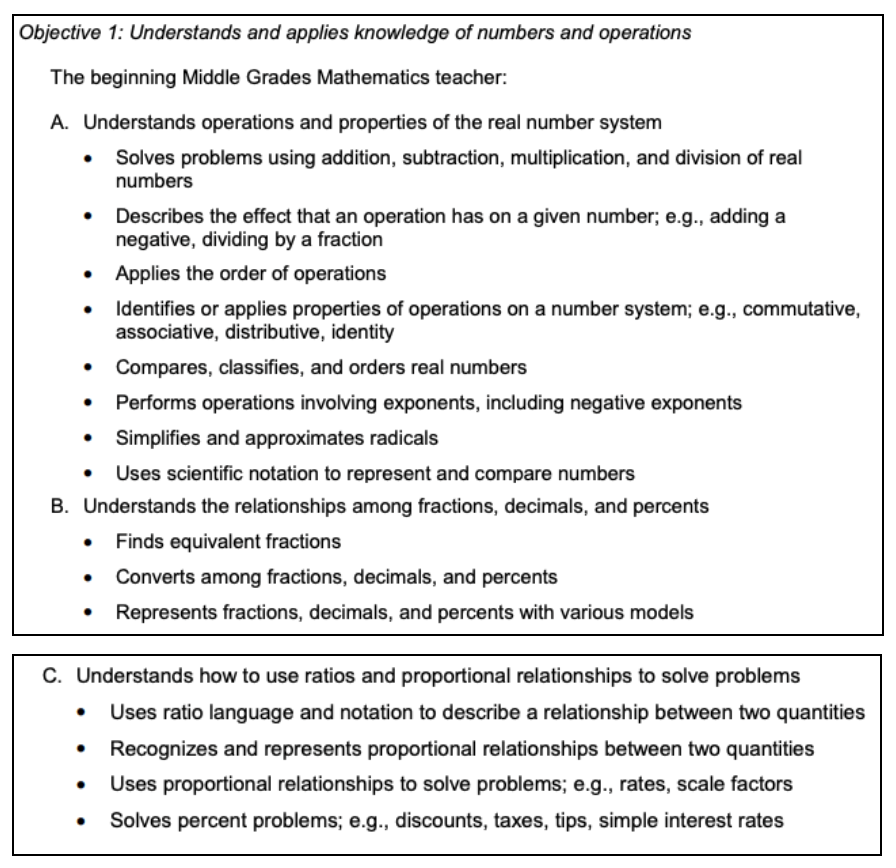
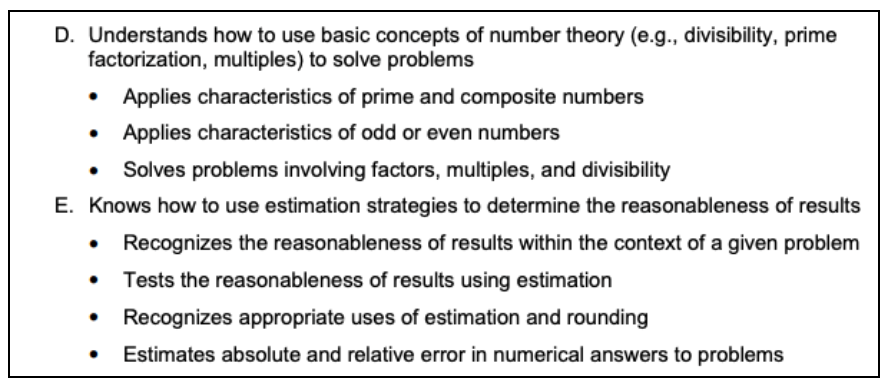
This section tests your ability to manipulate numerical expressions, as well as use ratios and proportions.
Let’s talk about some concepts that you will more than likely see on the test.
Prime Factorization
Prime factorization is breaking an integer down into its prime factors.
For example:
34 can be factored as 2
17. Since both 2 and 17 are prime numbers (they cannot be factored), 2(17) is the prime factorization of 34.
180 can be factored as 18
10. Both of these factors can be factored again. For example, 18 can be factored as 9
2, and 10 can be factored as 5
2:
180 = 18(10) = 9(2)(5)(2)
Now, all of these factors are prime except for 9, which can be factored as 3
3. Therefore:
180 = 3(3)(2)(5)(2)
Now, let’s group the factors that are duplicates:
180 =2²3²5
2²3²5 is the prime factorization of 180.
Absolute and Relative Error
Absolute error is the discrepancy between the actual value and the measurement you found.
For example, you have 20.2 mL of water in a vial. When you measure the volume of the water, you record the volume as 20.1 mL; therefore, the absolute error in your measurement is 0.1 mL.
However, suppose you estimate the internal temperature of a turkey at 170℉, when the actual temperature is 172℉. The absolute error in this situation is 2℉.
Now we have two different situations. In the first one, the absolute error is 0.1 mL, and in the second one, the absolute error is 2℉. How can we compare these errors since they are in different units?
This is where relative error is useful. Relative error is equal to the absolute error divided by the measurement.
In the case of the vial of water, the relative error =
0.1/20.1.≈.005. In the turkey situation, the relative error ≈
2/170≈.0118.
Algebra
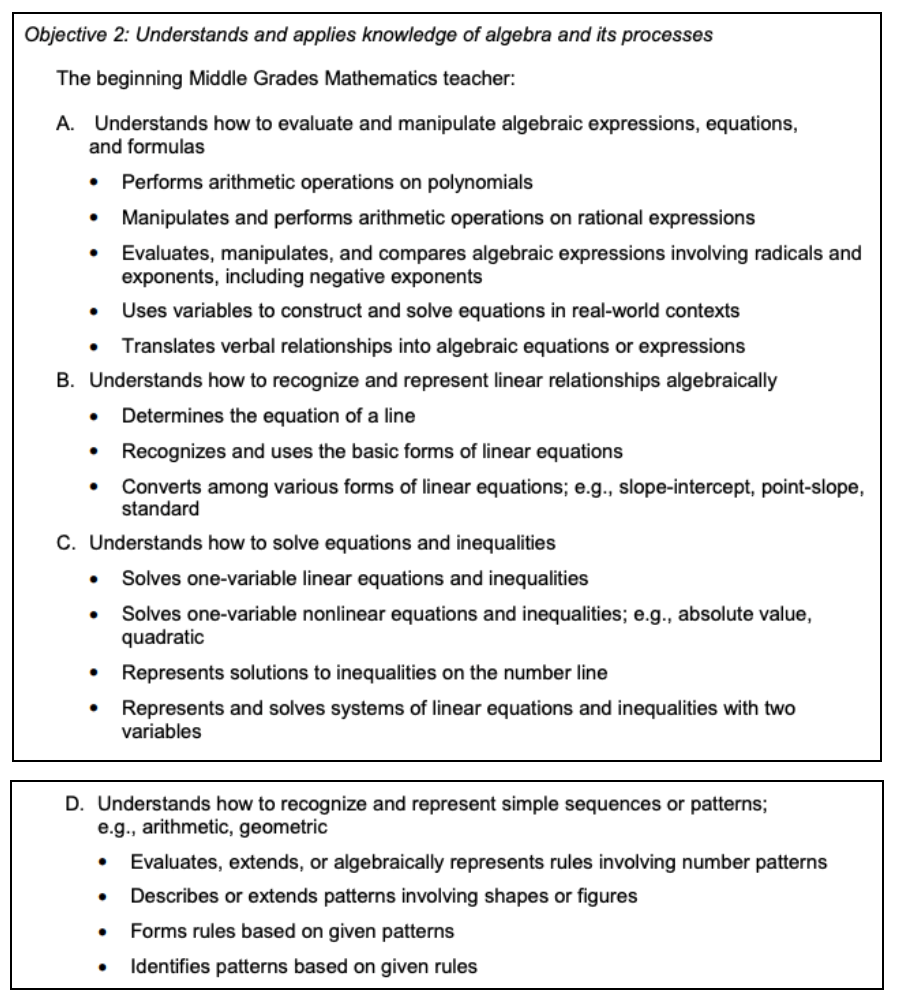
This section tests your ability to solve linear equations and inequalities, as well as represent patterns using sequences.
Here are some concepts you should know.
Linear Equations and Inequalities
Take a look at this
linear equation
in one variable:
5 x – 9 = 4
To solve this equation, we need to isolate the variable x . We can move the -9 to the other side by adding 9 to both sides:
5 x – 9 + 9 = 4 + 9
5 x = 13
Now we can move the 5 to the other side by dividing both sides by 5:
5x/5=13/5
x = 13/5
This is the solution to the equation.
Here is a
linear inequality
in one variable:
-7 x + 10 ≤ 31
To solve this inequality, again we need to isolate the variable x . Subtract 10 from both sides:
-7 x ≤ 31 – 10
-7 x ≤ 21
Divide both sides by -7:
x ≥ -3
*NOTE: When you multiply or divide an inequality by a negative number, you must reverse the inequality (flip the sign).*
We can represent the solution x ≥ -3 on a number line. Since this inequality uses the symbol “≥”, the solution includes the value -3 and everything greater than -3. So we shade to the right of -3 on the number line.

Quadratic Equations
Quadratic equations are equations where the variable has degree 2.
Let’s solve the quadratic equation:
5
x²
+ x = 2
Some quadratic equations can be solved by factoring; however, this equation can only be solved algebraically by using the quadratic formula or by graphing. We will solve using the quadratic formula.
To use this method, first put the equation into the form
a
x²
+ bx + c = 0
. To do this, subtract 2 on both sides of the equation:
5
x²
+ x – 2 = 0
Now we can see that a = 5, b = 1, and c = -2. We will plug these coefficients into the quadratic formula:
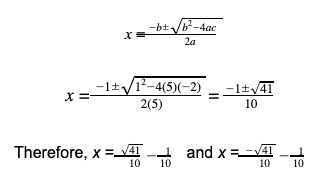
Functions and Their Graphs
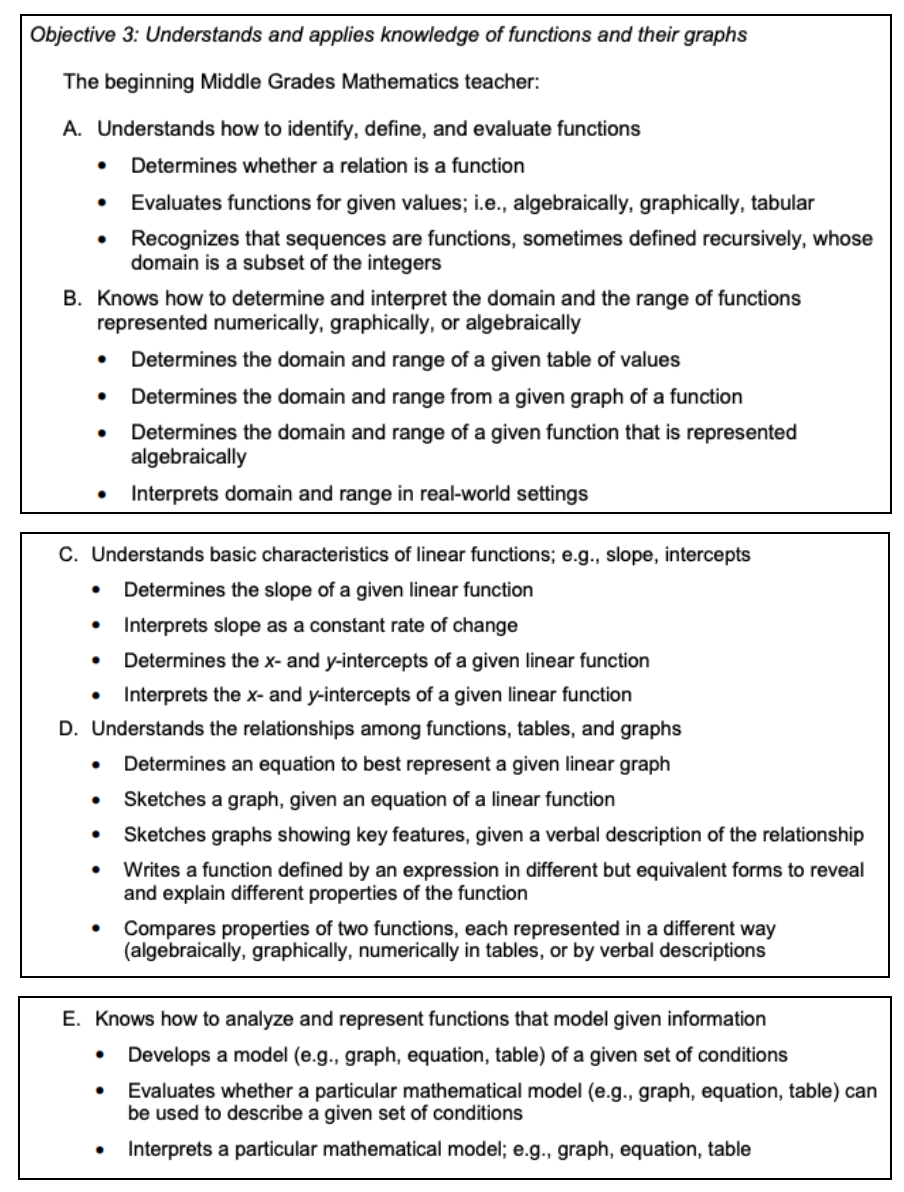
This section tests your knowledge of functions and their different representations, including notation. You’ll be evaluating functions, modeling with functions, and finding various properties of functions.
Let’s talk about some concepts.
Domain and Range
The
domain
of a function is the set of inputs that a function can take which produce a real number output.
The
range
of a function is the set of outputs a function can take on.
Example 1
: Consider the function f ( x ) = √(
4-
x²)
. For the x -values to be in the domain of this function, the expression under the square root cannot be negative, or the function will take on imaginary values. Therefore, we must solve:
2 ≥ x
Therefore, x must be less than or equal to 2. We can write the domain as the interval from 2 to infinity using the notation [2, ∞).
The range of f ( x ) is the set of values the function can take on. Since the output can never be negative for this function, the range is the set of all real numbers where x 0. We can write that in set notation as [0, ∞).
Example 2
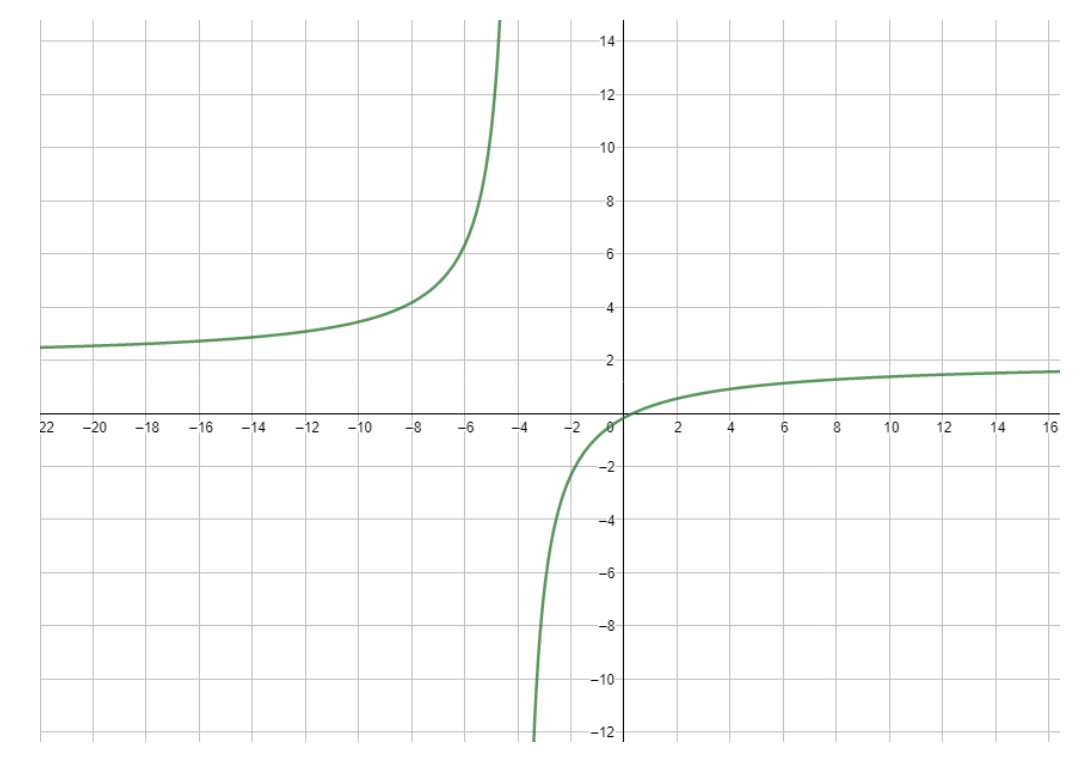
: Consider the function g ( x ) = (
6x-2)/(
3x+12)
.
This function can take on any value of x and produce a real number output, unless the denominator is zero; therefore, to find the value which is not in the domain, solve the equation 3 x + 12 = 0:
3 x = -12
x = -4
The domain of g ( x ) is therefore all real numbers where x≠ -4.
In set notation, this is written as (-∞, -4) U (-4, ∞).
The range of g ( x ) in this case is all real numbers where y ≠ 2.
You can see this from the graph of the function:
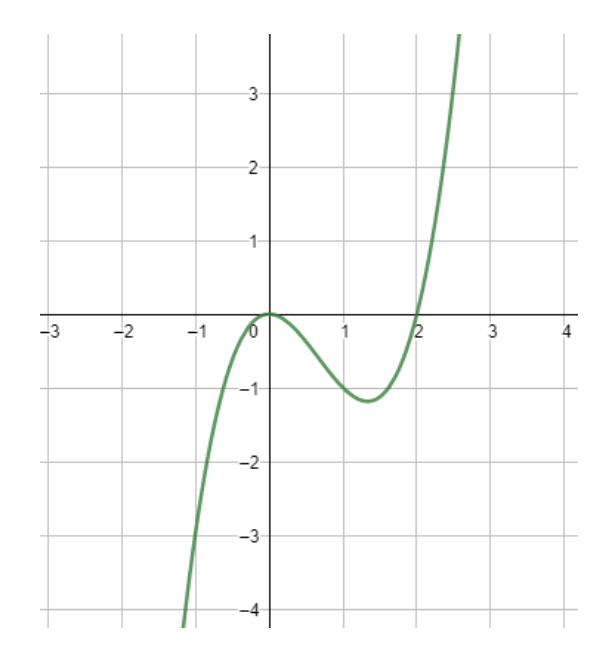
To evaluate the function graphically at -1, find the y -coordinate of the point on the graph that corresponds to x = -1.
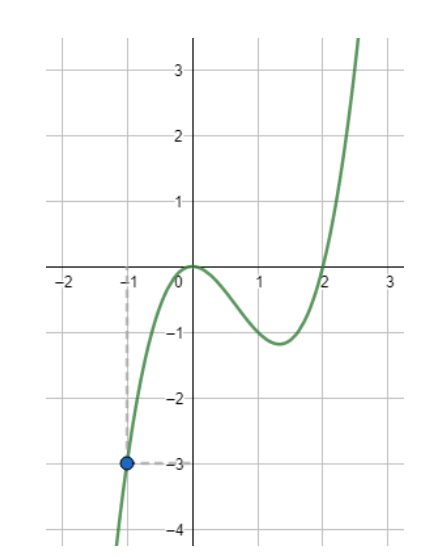
From the graph, you can see that the y -coordinate of the function at x = -1 is -3.
Therefore, f (-1) = -3.
Example 3
: Consider the function represented by the table below. Find f (3).

To find f (3), we need to find the value of the function at x = 3.

By looking at the table, we can see that f (3) = -2.
And that’s some basic info about the GACE Middle Grades Math Arithmetic and Algebra subarea.
Geometry and Data
This section tests your knowledge of functions and their different representations, including notation. You’ll be evaluating functions, modeling with functions, and finding various properties of functions.
Let’s talk about some concepts.
Domain and Range
The
domain
of a function is the set of inputs that a function can take which produce a real number output.
The
range
of a function is the set of outputs a function can take on.
Example 1
: Consider the function f ( x ) = √(
4-
x²)
. For the x -values to be in the domain of this function, the expression under the square root cannot be negative, or the function will take on imaginary values. Therefore, we must solve:
2 ≥ x
Therefore, x must be less than or equal to 2. We can write the domain as the interval from 2 to infinity using the notation [2, ∞).
The range of f ( x ) is the set of values the function can take on. Since the output can never be negative for this function, the range is the set of all real numbers where x 0. We can write that in set notation as [0, ∞).
Example 2
: Consider the function g ( x ) = (
6x-2)/(
3x+12)
.
This function can take on any value of x and produce a real number output, unless the denominator is zero; therefore, to find the value which is not in the domain, solve the equation 3 x + 12 = 0:
3 x = -12
x = -4
The domain of g ( x ) is therefore all real numbers where x≠ -4.
In set notation, this is written as (-∞, -4) U (-4, ∞).
The range of g ( x ) in this case is all real numbers where y ≠ 2.
You can see this from the graph of the function:
To evaluate the function graphically at -1, find the y -coordinate of the point on the graph that corresponds to x = -1.
From the graph, you can see that the y -coordinate of the function at x = -1 is -3.
Therefore, f (-1) = -3.
Example 3
: Consider the function represented by the table below. Find f (3).
To find f (3), we need to find the value of the function at x = 3.
By looking at the table, we can see that f (3) = -2.
And that’s some basic info about the Arithmetic and Algebra subarea.
Geometry and Data
The Geometry and Data subarea has about 16 questions. These questions account for 35% of the entire exam.
This subarea can be neatly divided into 2 sections:
- Geometry and Measurement
- Probability, Statistics, and Discrete Mathematics
So, let’s talk about the Geometry and Measurement section first.
Geometry and Measurement
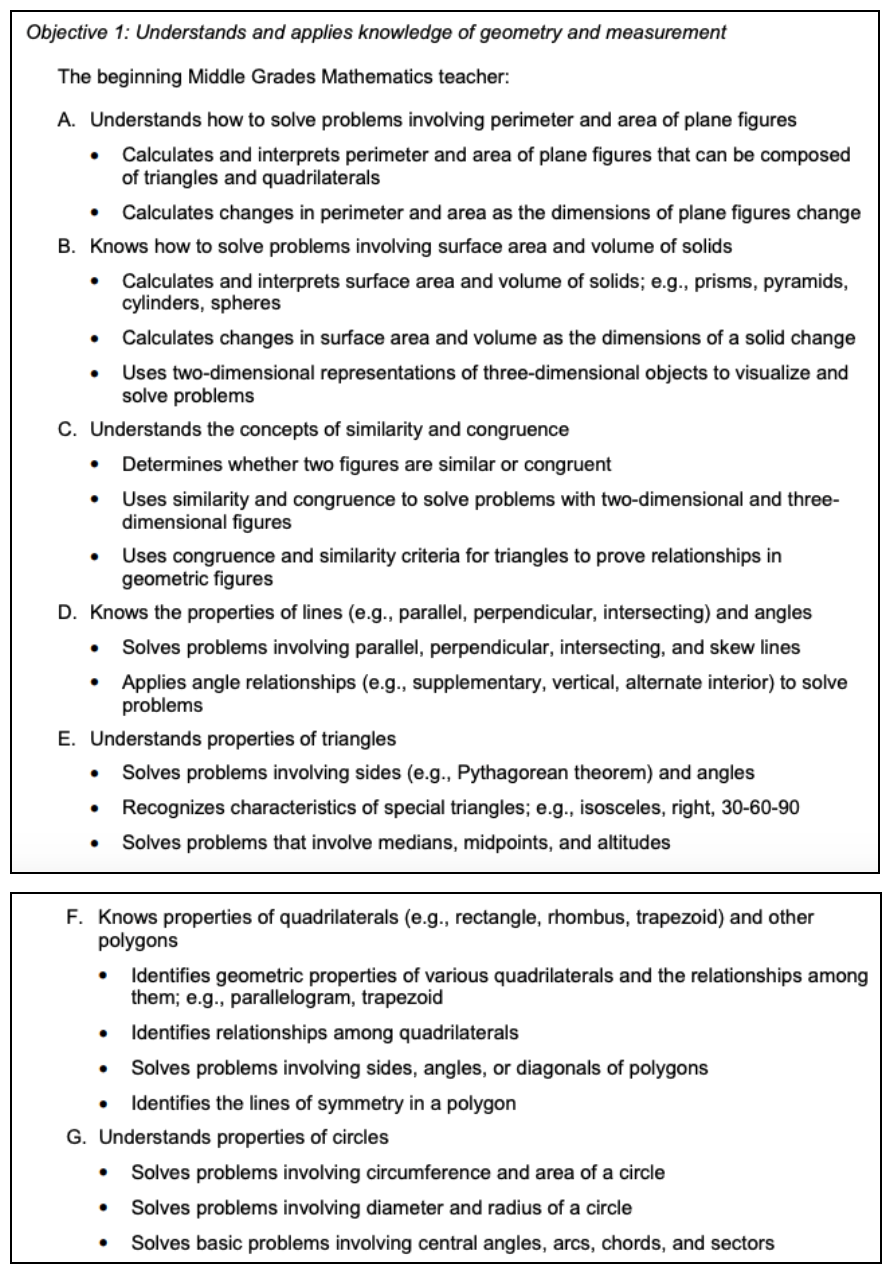
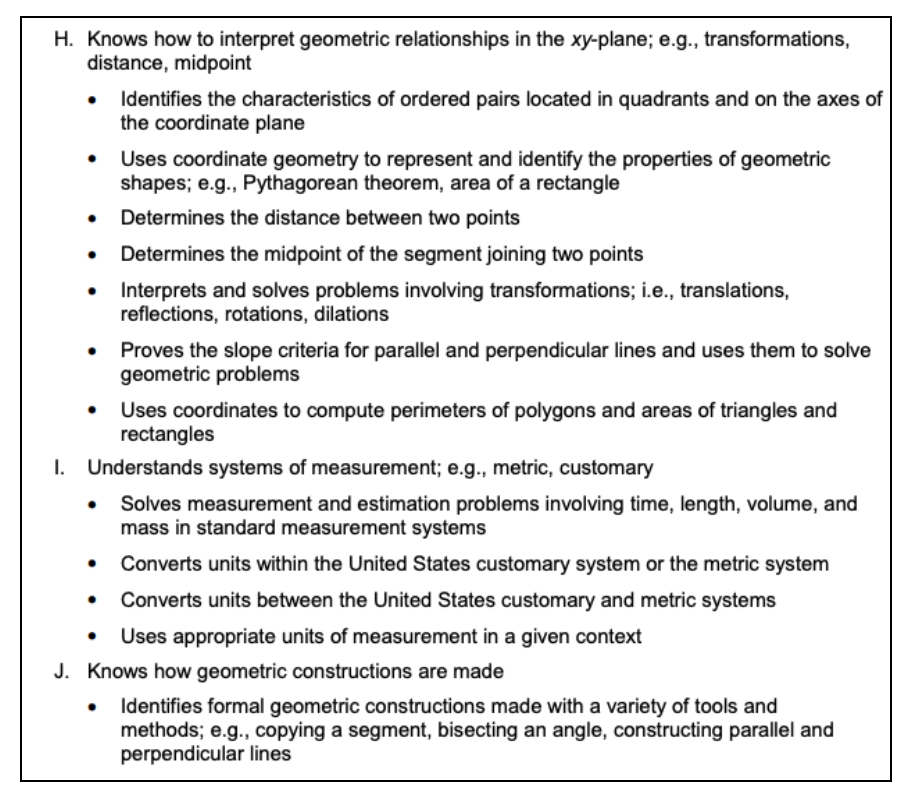
This section tests your knowledge of circles, triangles, quadrilaterals, area, volume, geometric transformations, congruence, properties of lines, and measurement.
Let’s take a look at some concepts that you definitely need to know for the test.
Angle Relationships
Angle relationships help us to find missing angles when we are given a diagram, often involving parallel and intersecting lines.
Some important angle relationships are supplementary, complementary, vertical angles, alternate interior angles, and alternate exterior angles.
Supplementary angles are angles whose measures add to 180 degrees. If the angles are next to each other, they will form a straight line.
Complementary angles are angles whose measures add to 90 degrees. If the angles are next to each other they will form a right angle.
For example, if ∡a=48° and ∡b=42°, then angle a and angle b are complementary since they sum to 90°.
Vertical angles are opposite each other on other sides of two intersecting lines. Vertical angles are always congruent (have equal measure).
For example, in the diagram below, angle a and angle c form a vertical pair. Angle b and angle d are also vertical to each other; therefore, we can say that ∡b=∡d and ∡a=∡c.
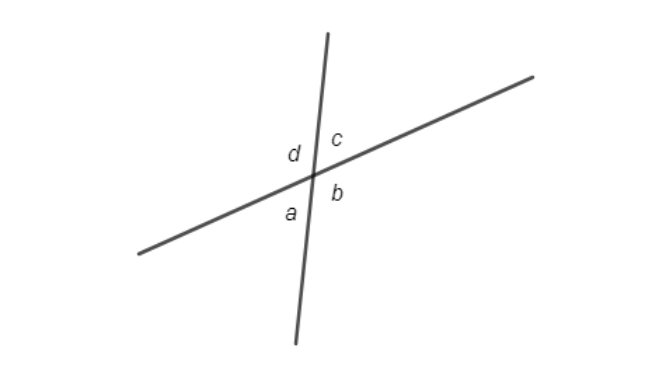
Also, angle a and angle d are supplementary, as are angle a and angle b . Other supplementary pairs are:
Angle b and angle c
Angle c and angle d
A transversal is a line that cuts through at least two other lines.
When we have transversals that cut through more than one line, they form alternate angles.
Alternate interior angles
are on opposite sides of the transversal but inside the two lines being cut by the transversal.
For example, in the diagram below, a and b are alternate interior angles, and c and d are alternate interior angles.
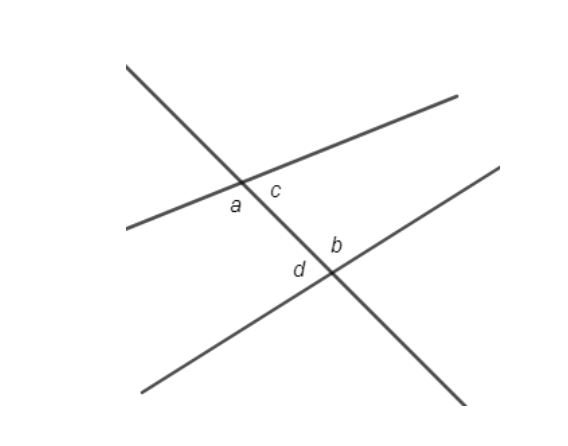
*NOTE: When the two lines cut by the transversal are parallel to each other, then alternate interior angles are always congruent.*
Likewise, alternate exterior angles are congruent if the two lines cut by a transversal are parallel. These are angles on the outside of the two lines, but opposite each other.
For example, in the diagram below, the two lines are parallel which we know by the arrow markings on them.
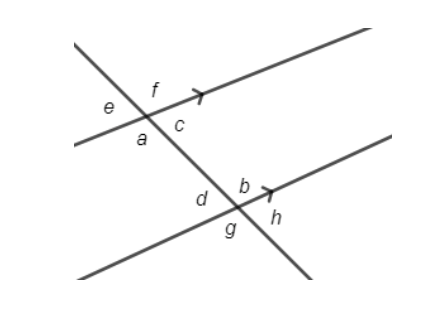
Angle e and angle h are therefore congruent, since they are alternate exterior angles. Angle g and angle f are also alternate exterior angles and therefore congruent.
Pythagorean Theorem
The Pythagorean Theorem is used to find the missing side of a right triangle.
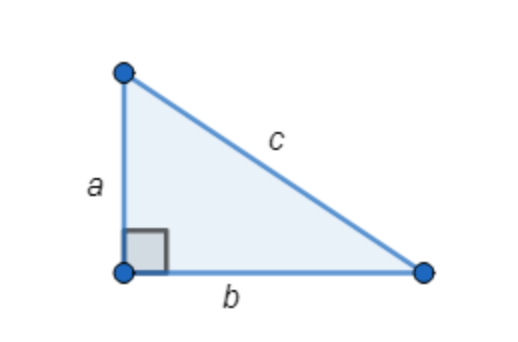
For the right triangle, where a and b are the shorter sides of the triangle, and c is the hypotenuse, then a 2 + b 2 = c 2 .
Example 1
: Suppose we know one side of a right triangle is 10 cm, and the hypotenuse of the triangle is 26 cm. Find the remaining side.
Let a = 10 cm and c = 26 cm. Then we will use the Pythagorean Theorem to find b :
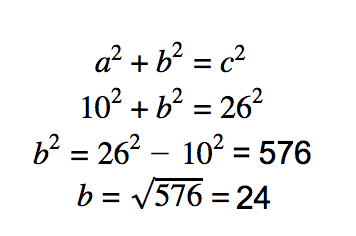
Therefore, the remaining side of the triangle is 24 cm.
Example 2
: Suppose two people start walking from the same point. After 1 hour, Person A has walked 2.8 miles due north. Person B has walked 3.2 miles due east. Find the distance between them at this time.
Since the two people are walking at right angles to each other, we can apply the Pythagorean Theorem. In this case, the distance between Person A and Person B is the hypotenuse of a right triangle.
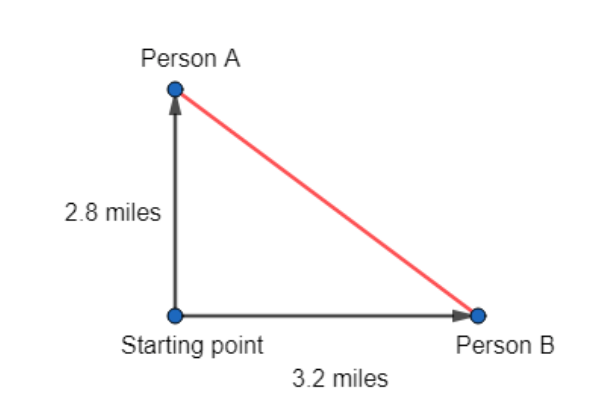
Let a = 2.8 and b = 3.2. Then a² + b² = c² gives:
2.8² +
3.2
² =
c²
18.08 =
c
²
c ≈
4.25
Therefore, Person A and Person B are approximately 4.25 miles apart after 1 hour.
This section tests your knowledge of circles, triangles, quadrilaterals, area, volume, geometric transformations, congruence, properties of lines, and measurement.
Let’s take a look at some concepts that you definitely need to know for the test.
Angle Relationships
Angle relationships help us to find missing angles when we are given a diagram, often involving parallel and intersecting lines.
Some important angle relationships are supplementary, complementary, vertical angles, alternate interior angles, and alternate exterior angles.
Supplementary angles are angles whose measures add to 180 degrees. If the angles are next to each other, they will form a straight line.
Complementary angles are angles whose measures add to 90 degrees. If the angles are next to each other they will form a right angle.
For example, if ∡a=48° and ∡b=42°, then angle a and angle b are complementary since they sum to 90°.
Vertical angles are opposite each other on other sides of two intersecting lines. Vertical angles are always congruent (have equal measure).
For example, in the diagram below, angle a and angle c form a vertical pair. Angle b and angle d are also vertical to each other; therefore, we can say that ∡b=∡d and ∡a=∡c.
Also, angle a and angle d are supplementary, as are angle a and angle b . Other supplementary pairs are:
Angle b and angle c
Angle c and angle d
A transversal is a line that cuts through at least two other lines.
When we have transversals that cut through more than one line, they form alternate angles.
Alternate interior angles
are on opposite sides of the transversal but inside the two lines being cut by the transversal.
For example, in the diagram below, a and b are alternate interior angles, and c and d are alternate interior angles.
*NOTE: When the two lines cut by the transversal are parallel to each other, then alternate interior angles are always congruent.*
Likewise,
alternate exterior angles
are congruent if the two lines cut by a transversal are parallel. These are angles on the outside of the two lines, but opposite each other.
For example, in the diagram below, the two lines are parallel which we know by the arrow markings on them.
Angle e and angle h are therefore congruent, since they are alternate exterior angles. Angle g and angle f are also alternate exterior angles and therefore congruent.
Pythagorean Theorem
The Pythagorean Theorem is used to find the missing side of a right triangle.
For the right triangle, where a and b are the shorter sides of the triangle, and c is the hypotenuse, then a 2 + b 2 = c 2 .
Example 1
: Suppose we know one side of a right triangle is 10 cm, and the hypotenuse of the triangle is 26 cm. Find the remaining side.
Let a = 10 cm and c = 26 cm. Then we will use the Pythagorean Theorem to find b :

Therefore, the remaining side of the triangle is 24 cm.
Example 2
: Suppose two people start walking from the same point. After 1 hour, Person A has walked 2.8 miles due north. Person B has walked 3.2 miles due east. Find the distance between them at this time.
Since the two people are walking at right angles to each other, we can apply the Pythagorean Theorem. In this case, the distance between Person A and Person B is the hypotenuse of a right triangle.

Let a = 2.8 and b = 3.2. Then a² + b² = c² gives:
2.8² +
3.2
² =
c²
18.08 =
c
²
c ≈
4.25
Therefore, Person A and Person B are approximately 4.25 miles apart after 1 hour.
Probability, Statistics, and Discrete Mathematics
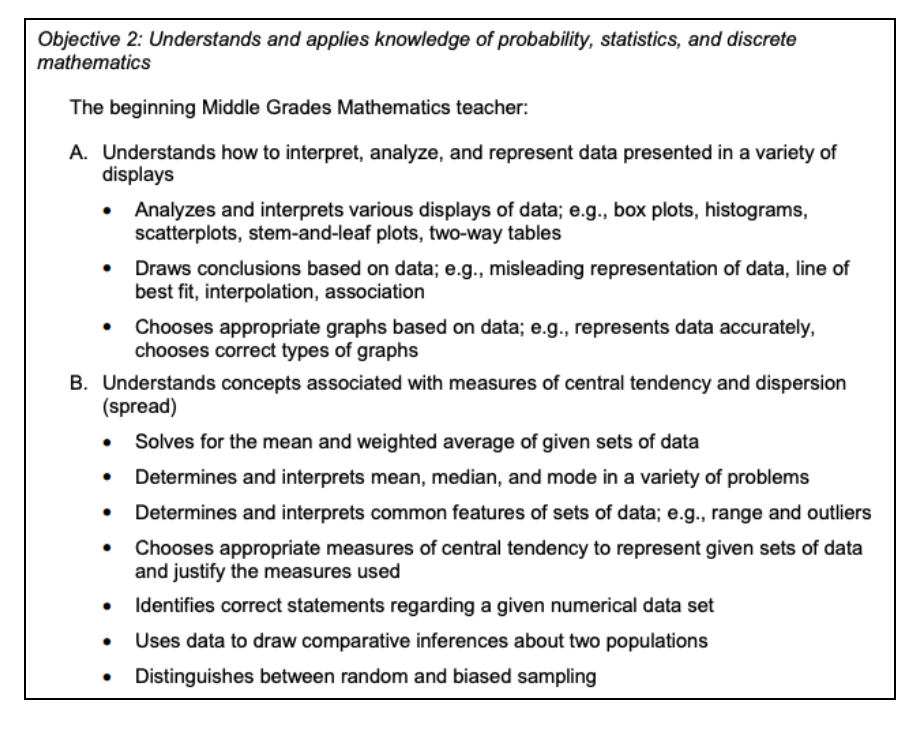
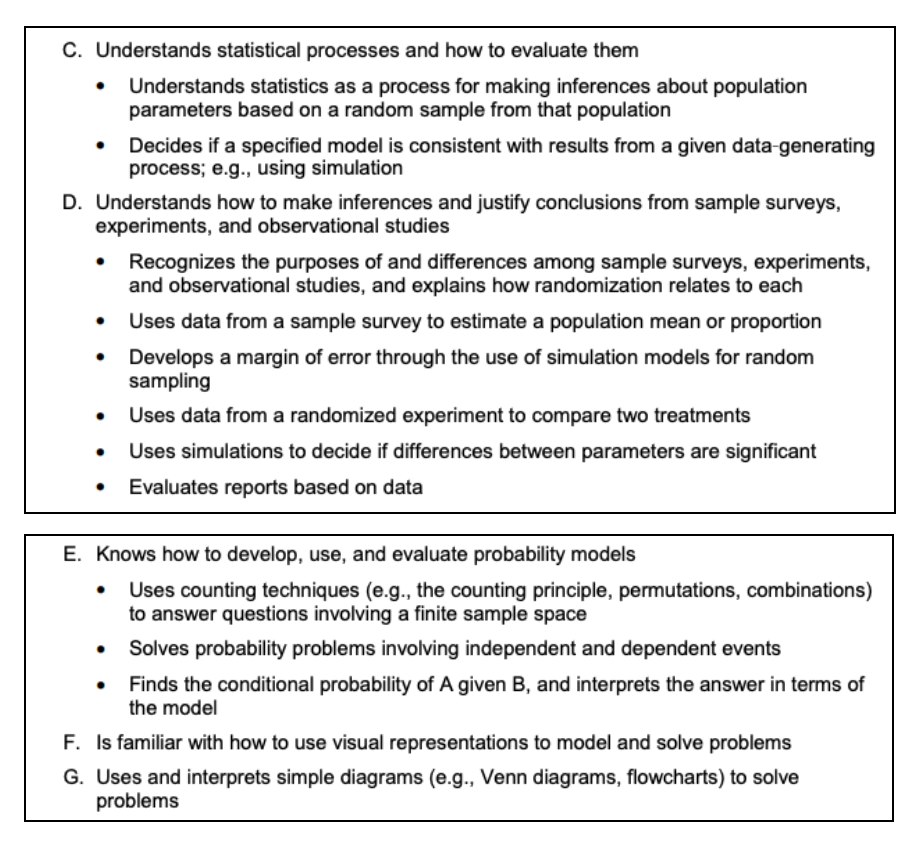
This section tests your knowledge of statistical measures, probability, algorithms, and charts.
Here are some concepts you need to know.
Measures of Central Tendency
Measures of central tendency help us to determine how data is distributed. We will consider several measures of central tendency below.
The mean of a data set is average value of a data set. This can be found by adding together all of the values and dividing by the total number of values.
The mode of a data set is the value that occurs most frequently in the data set. It is possible to have more than one mode in a data set if several values occur the most.
The median of a data set is the middle value in the set. If there is an even number of data points, there will not be an exact middle. In this case, the median is found by taking the average of the two data points closest to the middle.
For example, suppose that the ages for a group of ten students were collected and are listed below:
9, 11, 13, 11, 8, 7, 13, 9, 9, 12
The mean of this data set can be found by adding all of these ages together and dividing by 10, since there are 10 students:

To find the mode and median of a data set, it is helpful to reorder the set from lowest to highest.
7, 8, 9, 9, 9, 11, 11, 12, 13, 13
Now we can see that the mode of the data set is 9 since 9 occurs 3 times, which is more than any other data point.
Since the data set has an even number of values, there are two values in the middle: 9 and 11. To find the median, you must average 9 and 11; therefore, the median of the data set is 10.
Common Features of a Data Set
Other common features of a data set that we consider are range and outliers.
The
range
of a data set is the difference between the largest value in the set and the smallest value in the set.
An
outlier
is a data point that is far outside of the normal range of data points. In other words, it is far away from all the other data.
For example, consider the list of speeds of cars on the highway below in miles per hour:
75, 70, 83, 42, 72, 81, 75, 80, 76, 69, 68
First, reorder the set from least to greatest:
42, 68, 69, 70, 72, 75, 75, 76, 80, 81, 83
Now we can see that the smallest value in this set is 42, and the highest speed is 83. The range is the largest value minus the smallest value:
Range = 83 – 42 = 41
However, you may have noticed that the speed of 42 was much slower than the rest of the speeds recorded. Therefore, 42 is considered an outlier.
In many cases, the outliers of a data set are discarded so that the range provides a more accurate picture of the data distribution. If the speed of 42 is ignored, then the range of the data set (without that outlier) is 83 – 68 = 15.
And that’s some basic info about the Probability, Statistics, and Discrete
Mathematics subarea.
This section tests your knowledge of statistical measures, probability, algorithms, and charts.
Here are some concepts you need to know.
Measures of Central Tendency
Measures of central tendency help us to determine how data is distributed. We will consider several measures of central tendency below.
The
mean
of a data set is average value of a data set. This can be found by adding together all of the values and dividing by the total number of values.
The
mode
of a data set is the value that occurs most frequently in the data set. It is possible to have more than one mode in a data set if several values occur the most.
The
median
of a data set is the middle value in the set. If there is an even number of data points, there will not be an exact middle. In this case, the median is found by taking the average of the two data points closest to the middle.
For example, suppose that the ages for a group of ten students were collected and are listed below:
9, 11, 13, 11, 8, 7, 13, 9, 9, 12
The mean of this data set can be found by adding all of these ages together and dividing by 10, since there are 10 students:

To find the mode and median of a data set, it is helpful to reorder the set from lowest to highest.
7, 8, 9, 9, 9, 11, 11, 12, 13, 13
Now we can see that the mode of the data set is 9 since 9 occurs 3 times, which is more than any other data point.
Since the data set has an even number of values, there are two values in the middle: 9 and 11. To find the median, you must average 9 and 11; therefore, the median of the data set is 10.
Common Features of a Data Set
Other common features of a data set that we consider are range and outliers.
The
range
of a data set is the difference between the largest value in the set and the smallest value in the set.
An
outlier
is a data point that is far outside of the normal range of data points. In other words, it is far away from all the other data.
For example, consider the list of speeds of cars on the highway below in miles per hour:
75, 70, 83, 42, 72, 81, 75, 80, 76, 69, 68
First, reorder the set from least to greatest:
42, 68, 69, 70, 72, 75, 75, 76, 80, 81, 83
Now we can see that the smallest value in this set is 42, and the highest speed is 83. The range is the largest value minus the smallest value:
Range = 83 – 42 = 41
However, you may have noticed that the speed of 42 was much slower than the rest of the speeds recorded. Therefore, 42 is considered an outlier.
In many cases, the outliers of a data set are discarded so that the range provides a more accurate picture of the data distribution. If the speed of 42 is ignored, then the range of the data set (without that outlier) is 83 – 68 = 15.
And that’s some basic info about the Probability, Statistics, and Discrete Mathematics subarea.
